
In this article we will
create a dashboard using Excel Data Source. This Dashboard will
contain
KPIs and a Scorecard. Then we will deploy this dashboard to our
SharePoint Site.
The steps to create a
SharePoint Site using a Template Business Intelligence Center remains
the same as shown in my previous article
I also assume you have downloaded the Dashboard
and check the initial few steps to learn how to do so.
This Dashboard Designer
tool will help you to design the Data Sources, KPIs,
Scorecards,
Reports, Filters and Dashboards. The tool is shown below :

On the left hand section you will see the Workspace Browser. In this window, you will
see two settings:
1) Data Connections.
a. It is used for creating a connection with different types of data sources.
b. For our demonstration, we are going to use a multidimensional Data Source that
is Excel Services.
2) PerformancePoint Content –
a. Using PerformancePoint Content we can design KPIs, Filters, Reports, Dashboards,
Indicators and Scorecards as shown below:

For this demonstration
we are going to use Excel Data source. For this, you need to create an
Excel workbook with the following data:

Save this Excel workbook on your local machine. I have saved this workbook with
name ‘Book1’.
Now let’s create a Data source using our Dashboard Designer tool. For creating
Excel Data source follow these steps:
Step 1: Right click Data Connections > Click on ‘New Data Source’ as shown below:

From Select a Data Source Template window, make a choice of ‘Import from Excel
Workbook’ as shown below:

Rename this data source
as “Excel DS”. Click on “Import” button. This will prompt you
to browse
the excel sheet which we created above. Browse your excel workbook
and
click on the “Open” button. In our case, I am going to open “Book1”.
You will see one dialog box on the right hand side as shown below:
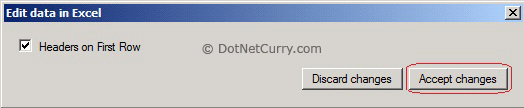
Step 2:
Click on ‘Accept Changes’ button. This will make your headers as the
first
row in excel sheet. Your Excel Data Source will look similar to
the following:

Save your data source.
Create Scorecard and KPI’s from Excel Data Source
Now let’s create a
Scorecard and KPIs from our Excel Data source, which we just
created in
the above steps. To do this, follow these steps:
Step 1:
Right click PerformancePoint Content > New > Scorecard. From the
Tabular category, choose ‘Excel Workbook’ as shown below:

Clicking on the OK
button will take you to the wizard. The first step is to choose the Data
source. Now let’s make a choice of ‘Excel DS’ data source which we
created above. Click on ‘Next’ button.
Step 2: In the next step, let’s add two KPIs as below:

Your wizard should look similar to the one shown below:

Keep all the options default and finish the wizard. Rename your scorecard as ‘Excel Scorecard’.
Step 3:
After this step, we are going to modify our Scorecard. From the
‘Details’ window
on the right hand side, collapse the dimensions and
drag and drop ‘State’ dimension
to ‘Sales’ and ‘COGS’ KPIs as shown
below:

Now drag and drop the ‘Time’ dimension on ‘Actual’ and ‘Target’ as shown below:

Now go to ‘Edit’ Ribbon and click on ‘Update’ button. Your scorecard should look similar
to the following:

You are ready with your scorecard.
Create a Dashboard using Scorecard
Let’s create a Dashboard which will contain our scorecard. To create a Dashboard, follow these steps:
Right click
PerformancePoint Content > New > Dashboard. Make a choice of ‘One
Zone’ dashboard template from the pop-up dialog box and Drag and Drop
Excel Scorecard from the ‘Details’ windows as below:

Now Save your dashboard
and deploy it to SharePoint Site. After deploying it to SharePoint
Site, it will look similar to the following:

Conclusion
In this article, we
have seen how to make use of Excel workbook data for creating Excel Data
Source in Dashboard Designer tool. We have also seen how to create
KPIs, Scorecard and a Dashboard using Excel Data Source. For this demonstration, we have used Microsoft Excel Workbook as a source of our data for creating our Dashboard.
No comments:
Post a Comment